This is the first part in a series exploring Google Analytics for innkeepers.
You’ve eagerly installed Google Analytics on your site. You’ve waited impatiently for a few days to let data pile up. Now you’ve logged in to Analytics—and are overwhelmed by numbers.
Rates, percentages, visits, traffic, “absolute unique visitors”—what does it all mean?
Don’t panic, gentle innkeeper. Below is a guide to the Analytics jungle pointing out the most useful benchmarks and giving tips on how to interpret them. This is the first in a series introducing innkeepers to the ins and outs of Analytics, so stay tuned for more.
If there’s one number I should pay attention to, what is it?
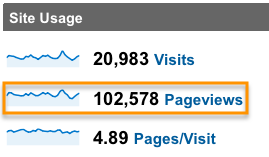
Pageviews is a nice blend of visit quantity and visit quality. This number represents the total number of pages on your site that all of your visitors have viewed. For example, let’s say Joe visits sampleinn.com and looks at the home page, two room pages, and the breakfast page. Later that day, Ellen looks at sampleinn.com’s packages page, then five room pages. The total pageviews for sampleinn.com on that day is ten: four pageviews from Joe and six pageviews from Ellen.
By comparing this month’s pageviews to last month’s or last year’s, you can get a rough idea of how many people are visiting your site and how interested they are. If you have fewer pageviews this year, either your site is attracting fewer visits or visitors are more quickly losing interest in your site—or both. It might be time to make some changes on your site.
Tip: Be careful not to pin all your hopes on a single number. Your visitors interact with your website in all sorts of complicated ways, and one number can’t possibly tell the whole story. Pay attention to pageviews, but keep an eye on the rest of Analytics, too.
What other numbers are important?
Overall visits tells you how many people came to your site, and bounce rate, pages per visit, and average time on site tell you about the quality of those visits.
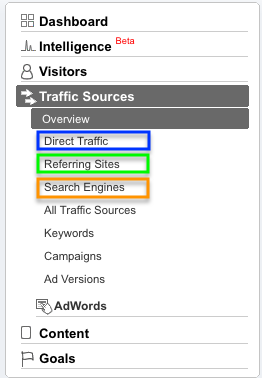
Visits, also called traffic, is simply the number of times that people came to your site. Visitors arrive at your site through one of three traffic sources:
- Direct traffic visitors type your site’s address directly into the address bar of a browser. They might also have your site bookmarked. These visitors are already familiar with your business.
- Referral traffic visitors arrive at your site by clicking a link on a directory, a friend’s blog post, a Facebook update, or another outside site.
- Search traffic visitors find your site by typing keywords into Google, Bing, or another search engine. Showing up in search results has the highest potential to reach the most people.
Bounce rate is the percentage of visits to your site by people who look at one page, then leave. A high bounce rate indicates that your site isn’t meeting your visitors’ expectations. Is your site five or more years old? Visitors might be disappointed by an aging site design. Do you blog? Blogs tend to raise bounce rates because visitors often read only one post—and that’s okay. Also, expect a different bounce rate for each traffic source.
- If your direct traffic bounce rate is high, visitors might be looking for your phone number or checking directions.
- Your referral traffic bounce rate should be low, around 20%, because visitors are actively seeking information.
- If you don’t blog, aim for a search traffic bounce rate of 25–30%. If you do blog, expect your bounce rate to rise as your blog becomes more popular. Blogging innkeepers can feel comfortable with a bounce rate up to 35%.
Pages per visit is the average number of pages that each visitor views during each visit. The higher the number, the more interested visitors are in your site. Your ideal pages-per-visit number will vary depending on whether you have a simple, five-page B&B site or a sprawling dude ranch site with a blog.
Average time on site often mirrors pages per visit. The more time visitors spend on your site, the more interested they are. Again, your ideal average time depends on your site.
Tip: When one of your statistics plummets, don’t panic—investigate. For example, if your total visits are down, take a look at your bounce rate. If your bounce rate has fallen too, congratulations: the visits you lost were poor-quality bouncing visits that didn’t help you anyway.
Also check these numbers for each traffic source separately. Are bounces for one particular referring site dragging up your overall bounce rate? Does your site show poor statistics for specific kinds of searches? For example, do people searching for information about New York wines find the wine list page on your site and bounce away?
What time range should I look at?
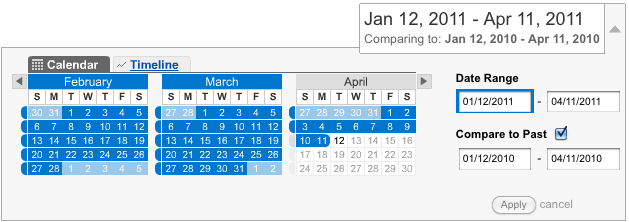
By default, Analytics shows you your statistics from the most recent month. You can look at different date ranges by clicking on the gray down-arrow to the right of the dates. This opens a drop-down box where you can specify custom date ranges and comparison dates.
For a long-term perspective, view the most recent three months and compare them to the same period the year before. By using last year’s numbers as a comparison, you factor out seasonal fluctuations. For example, it might not make sense to compare January, February, and March to April, May, and June. However, by comparing this April to last April, you can see long-term changes and stable trends.
To see shorter-term trends, like the effects of your new ad campaign or the popularity of your new romance package, view the past month or the past two weeks and compare to the previous time period. Note, though, that short time ranges are subject to normal fluctuations. If, for example, your bounce rate has risen a percentage point this week compared to last week, don’t worry—your site will naturally go through some ups and downs. If your bounce rate continues to rise week after week, it’s time to investigate.
So that’s it, huh?
Analytics can show you so much information about so many aspects of how visitors use your site: What cities are your visitors from? How many people visit your site on a mobile device? Which pages do visitors spend the most time on? Most importantly, who converts to booked guests? We’ll explore these questions and more in upcoming posts.
For now, start by paying attention to pageviews, visits, and bounce rate, then explore referral traffic and search traffic. Soon you’ll feel as comfortable in the Analytics jungle as in your own guest rooms.


